
Course.link provides detailed analytics to help you understand your course performance, track revenue, and monitor student engagement. Here’s how to navigate and interpret the analytics.
Go to your Course.link dashboard and you will see your analytics on the Home section.
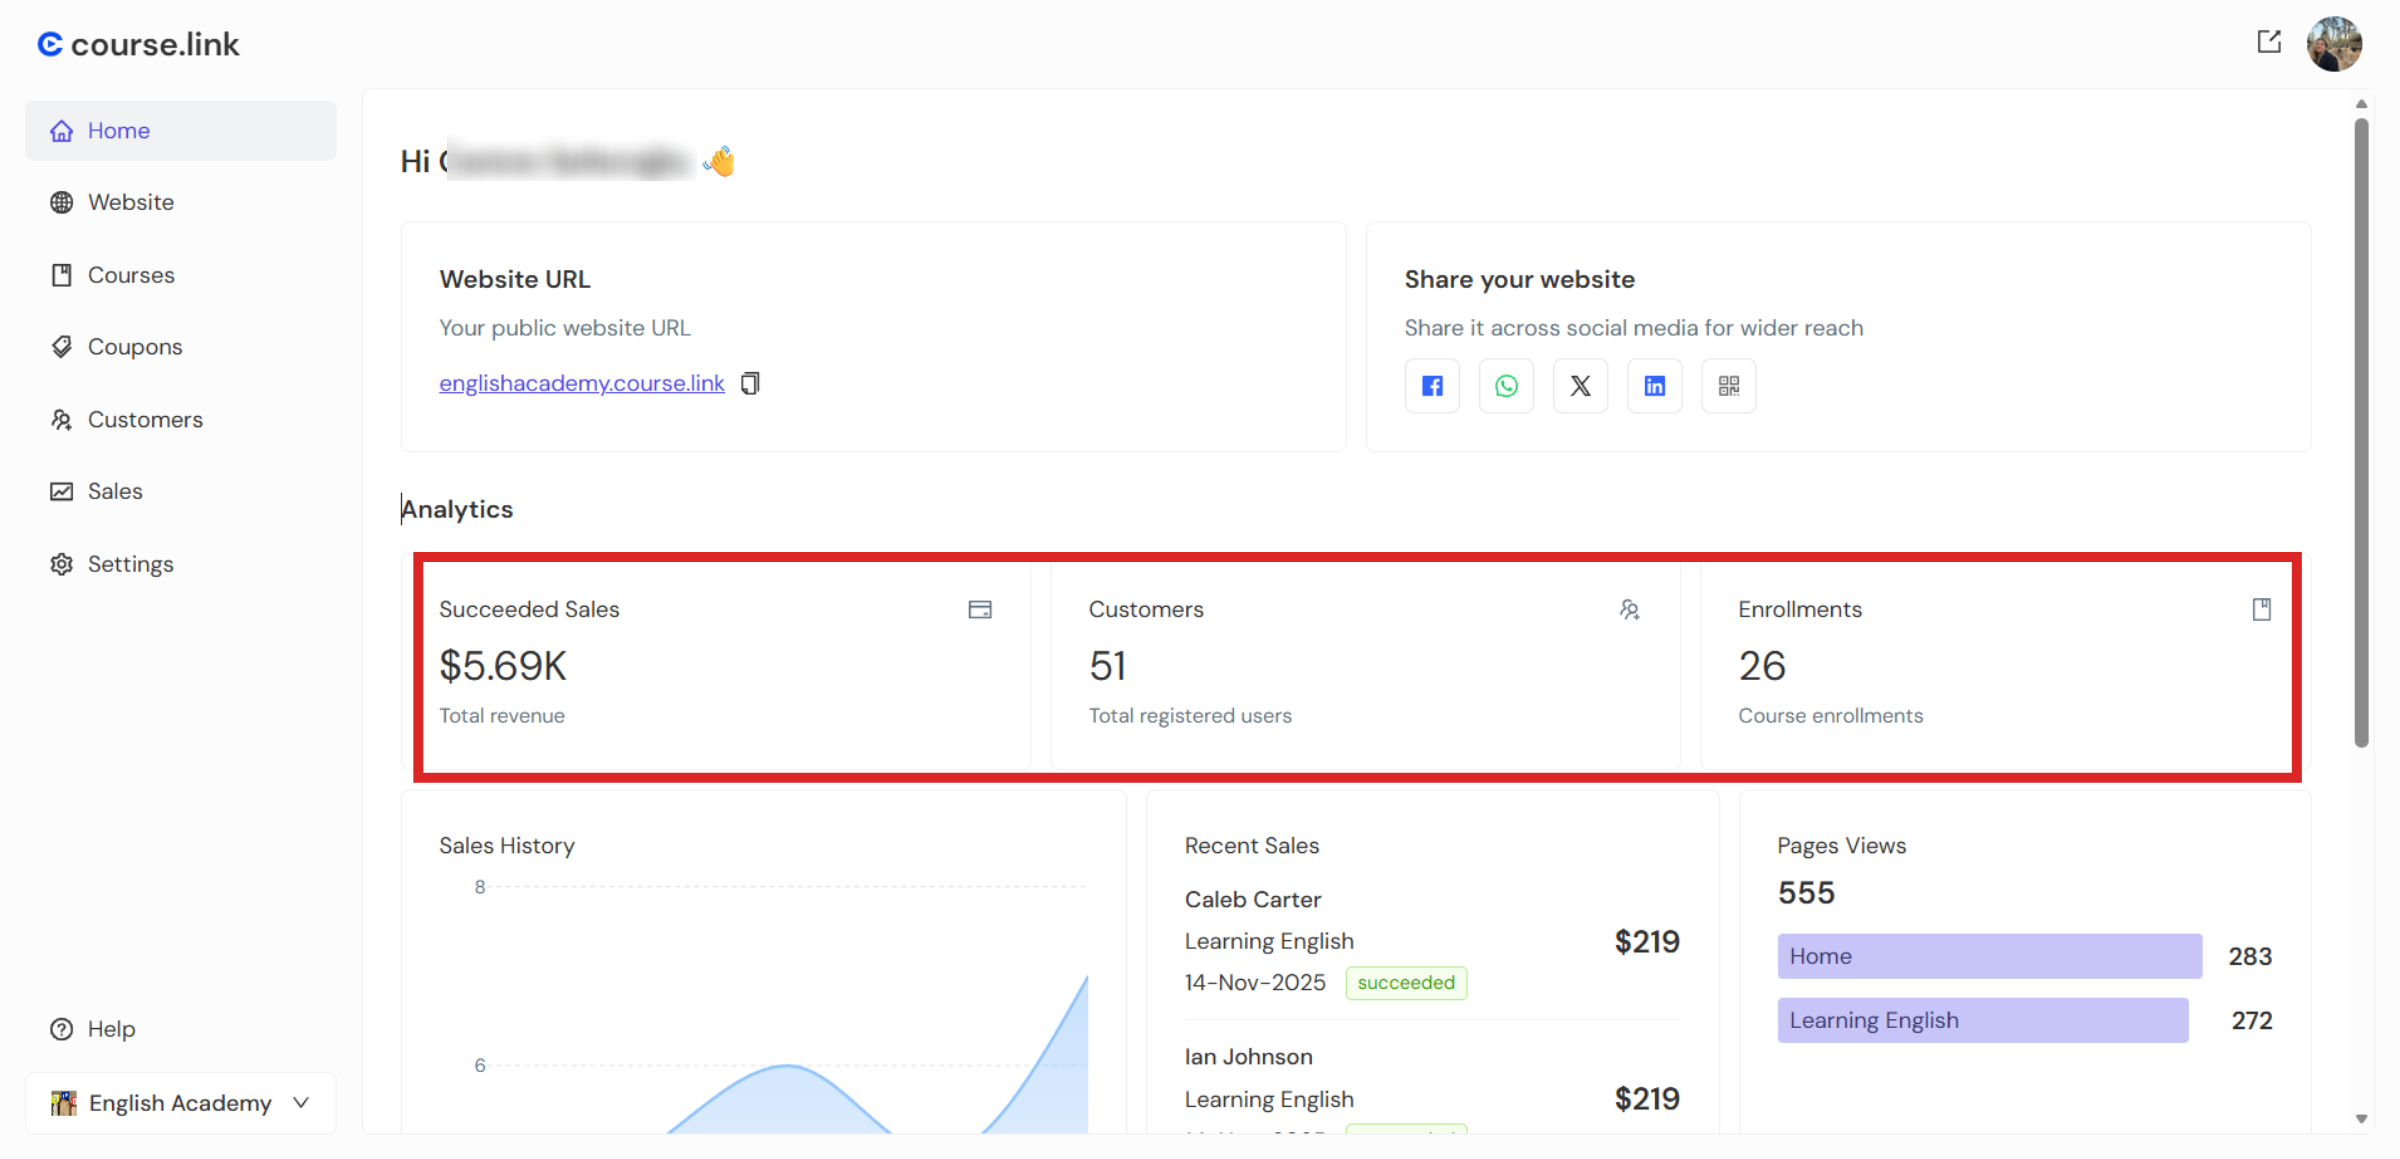
Succeeded Sales: This section shows your total revenue from all course sales. You can quickly see how much income your courses are generating over time.
Customers: Here, you can view the number of students who have purchased or subscribed to your courses. This gives you insight into your audience size and growth.
Enrollments: The enrollments metric tells you the number of courses your customers have subscribed to. Remember, a single student can subscribe to multiple courses, so this number may be higher than your total number of customers.
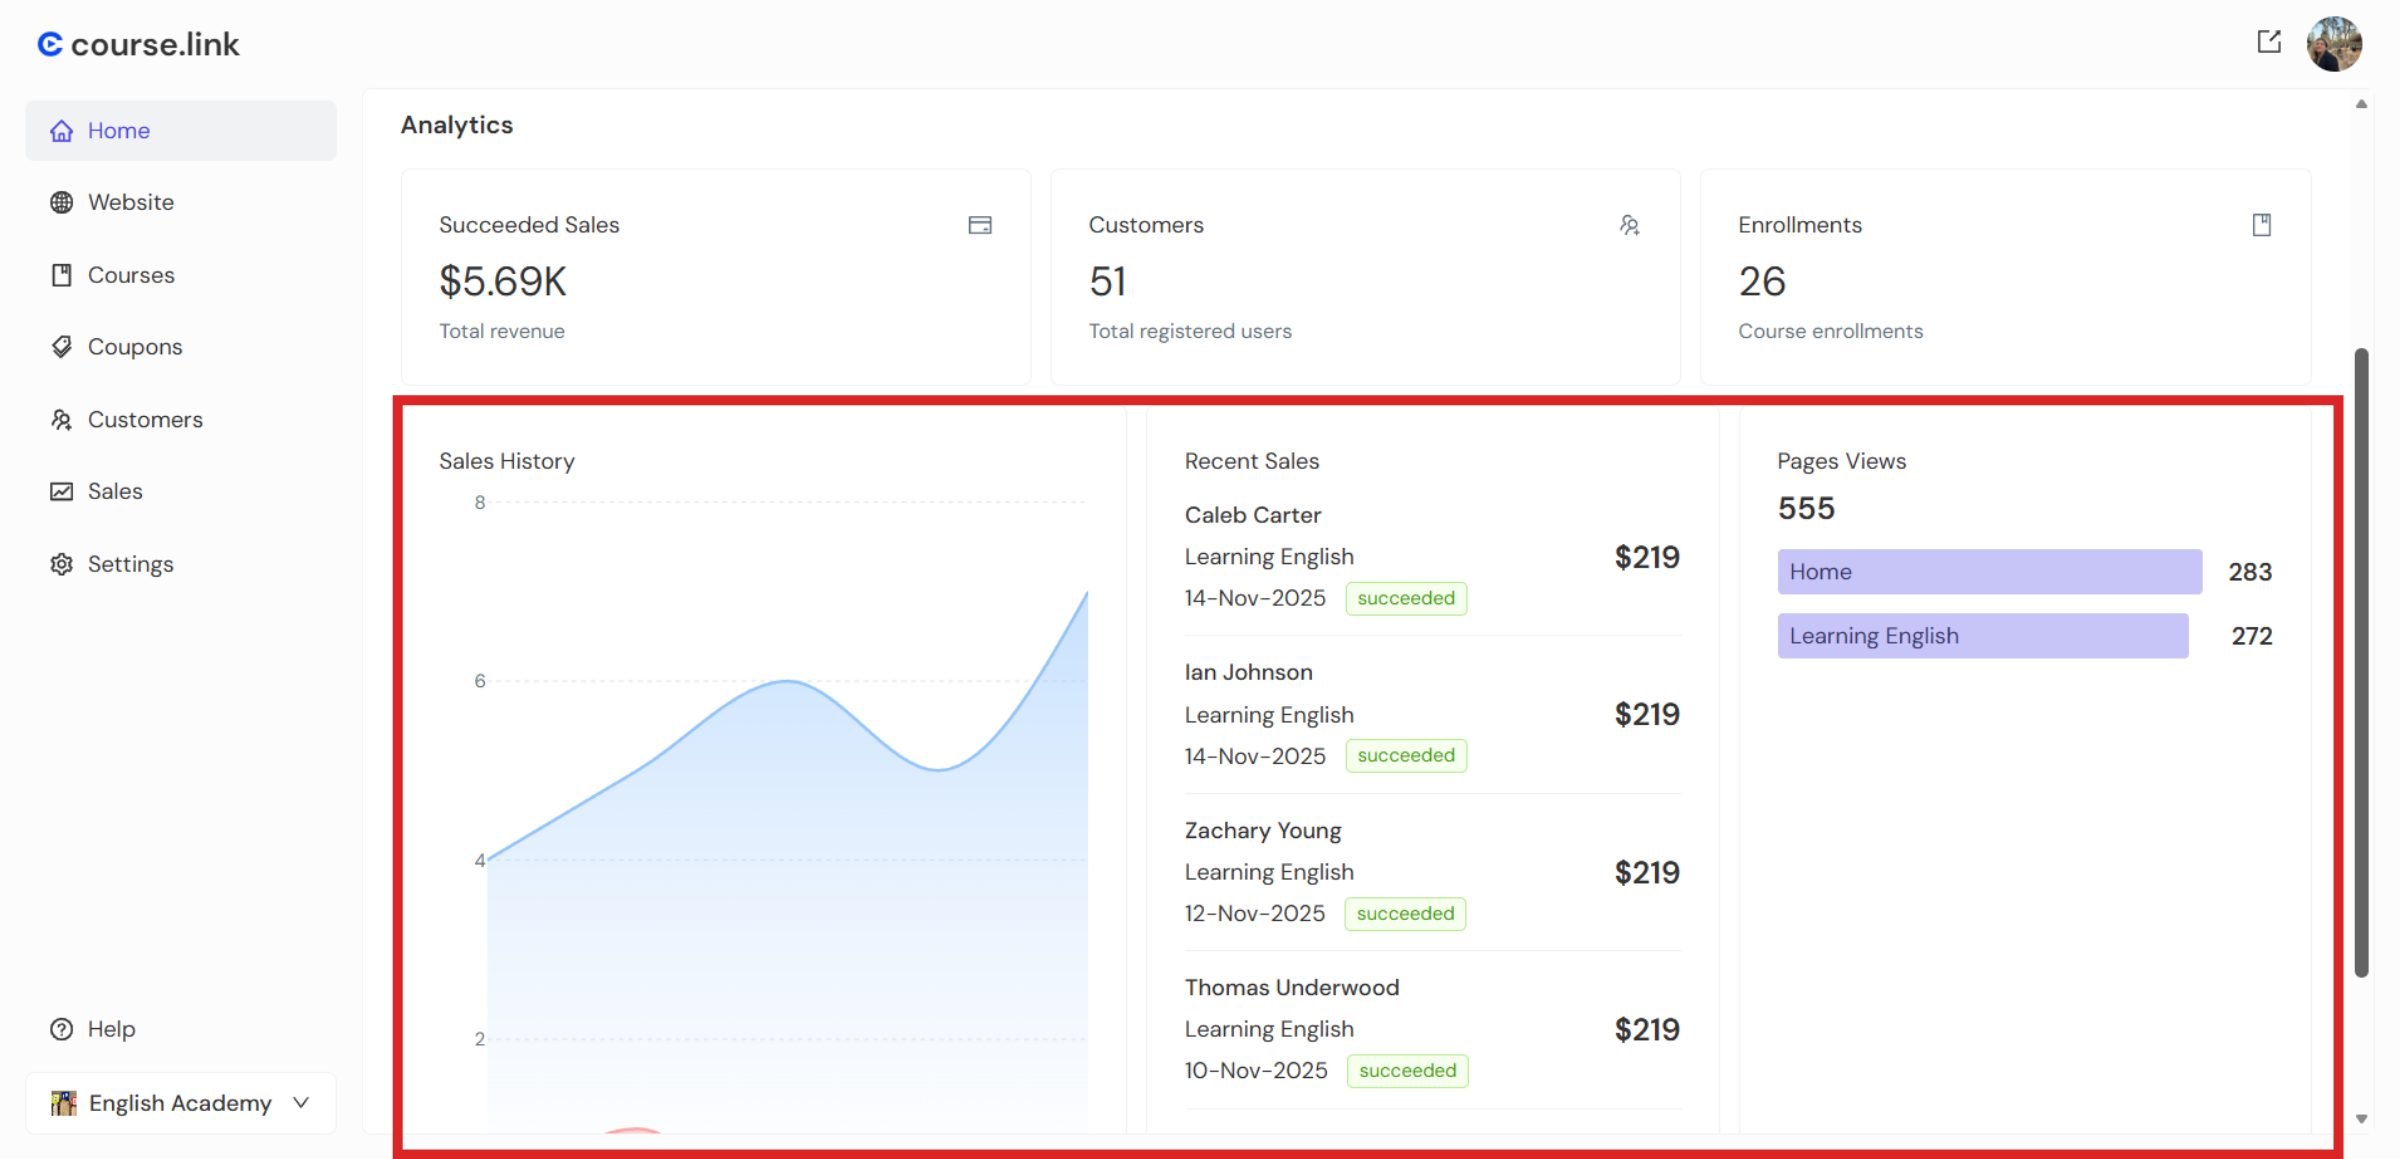
Sales History: The sales history section displays a graph of your sales over time. Use this visual to identify trends, such as peak periods and slow seasons, to plan marketing or new course launches.
Recent Sales: The recent sales section shows your most recent transactions, so you can quickly track the latest purchases and monitor ongoing sales activity.
Page Views: The page views section shows which courses are being viewed the most. This helps you understand which courses are attracting the most interest and may guide you in promoting or updating popular courses.
Still need help?
Contact us